Object Dashboard
The object dashboard provides the most detailed description of a single
database object. Select a database tile from the
Database Summaries section of a
server's dashboard to open the database dashboard, then select a table, index,
or query from one of the leaderboards to open the object dashboard for the
selected object.
Reviewing Table Details
When you select a table name from the Table Leaderboard, the console displays
details about that tables size, performance, and maintenance history. The
dashboard summarizes the table using the latest pg_stat_all_tables snapshot
and a set of time-series charts.
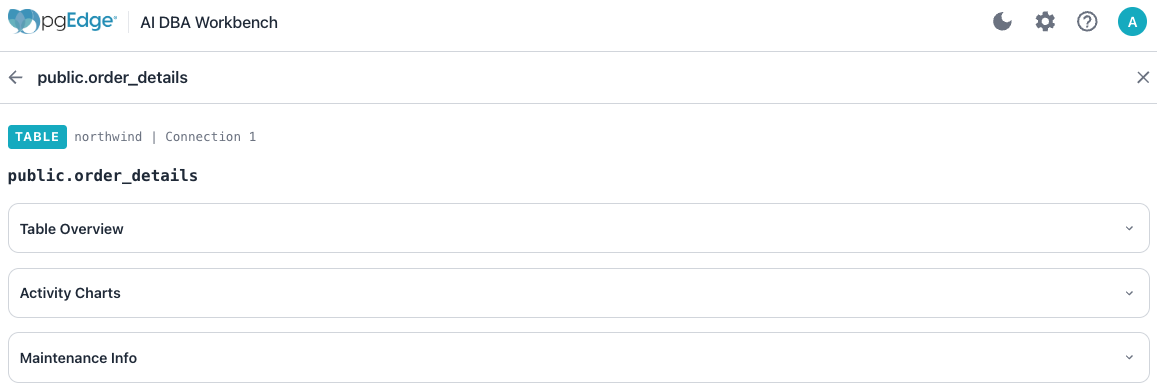
The header shows the fully qualified schema.table name above three sections;
the Table Overview, Activity Charts, and Maintenance Info. Use the arrow
at the right side of each section to open or close that section.

The Table Overview section presents four key statistics for the table:
- The
Live Tuplestile shows the estimated number of live rows, formatted with thousands separators. - The
Dead Tuplestile shows dead rows with a% deadqualifier computed as dead tuples divided by live plus dead tuples. The dead tuple percentage is color-coded, marking values at or below 5% good, values through 20% warning, and higher values critical. - The
Table Sizetile shows the on-disk table size in a human-readable form (for example,480 kB). - The
Sequential Scanstile shows the cumulative sequential scan count for the table.
A statistic without a recorded value displays -- in place of a number.
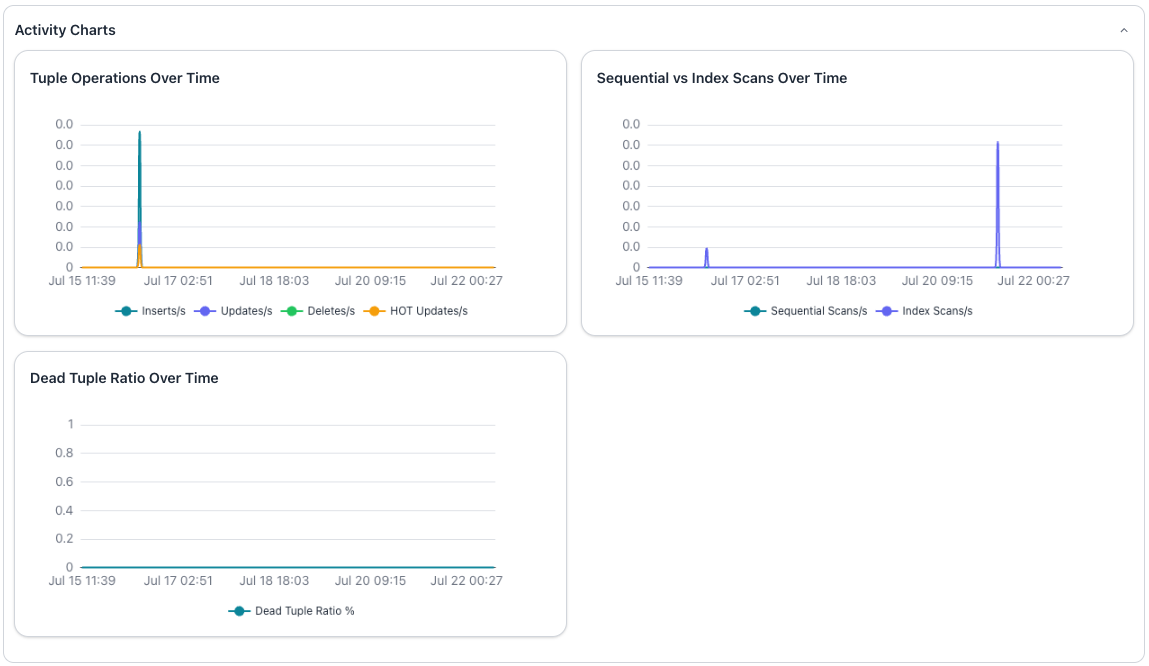
The Activity Charts section renders three line charts that conform to the
dashboard time-range selection and refresh with the dashboard:
- The
Tuple Operations Over Timechart plots per-second rates for inserts, updates, deletes, and HOT updates. - The
Sequential vs Index Scans Over Timechart compares the per-second sequential scan rate against the index scan rate. - The
Dead Tuple Ratio Over Timechart plots the dead tuple percentage as a shaded area to highlight vacuum effectiveness.
Each chart shows a message such as "No tuple operation data available" when the selected time range contains no samples.

The Maintenance Info panel reports the four maintenance timestamps that
PostgreSQL records for the table:
- The
Last Vacuumfield shows the time of the last manualVACUUM. - The
Last Autovacuumfield shows the time of the last scheduled autovacuum run. - The
Last Analyzefield shows the time of the last manualANALYZE. - The
Last Autoanalyzefield shows the time of the last scheduled autoanalyze run.
A field displays Never when the corresponding operation has not run since
statistics were last reset.
Reviewing Index Details
When you select an index name from the Index Leaderboard, the console
displays details about the indexes size and usage. The index detail summarizes
a single index using the latest pg_stat_all_indexes snapshot and a
time-series chart.

The header shows the fully qualified schema.index name, followed by a line
naming the table that the index serves. Two sections follow: Index Overview
and Scan Activity.

The Index Overview section presents four key statistics for the index:
- The
Index Sizetile shows the on-disk index size in a human-readable form, such as176 kB. - The
Index Scanstile shows the cumulative number of scans started on the index, formatted with thousands separators. - The
Tuples Readtile showsidx_tup_read, the number of index entries returned by scans of the index. - The
Tuples Fetchedtile showsidx_tup_fetch, the number of live table rows fetched by simple index scans that use the index. - The fetched count usually trails the read count, because index-only scans and bitmap scans avoid fetching individual table rows.
A statistic without a recorded value displays -- in place of a number.
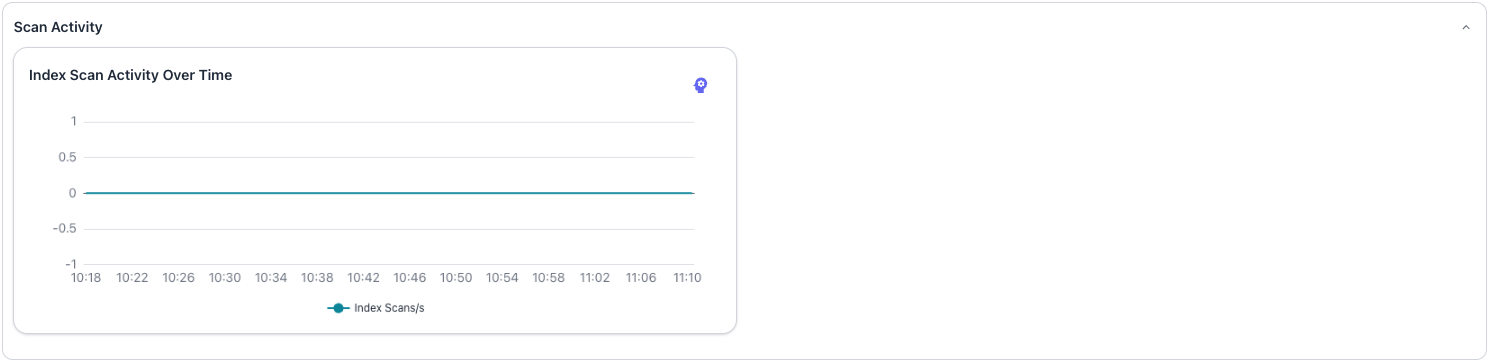
The Scan Activity section renders a line chart that follows the index
activity for the duration of the database dashboard's time-range selection:
- The
Index Scan Activity Over Timechart plots the per-second index scan rate as theIndex Scans/sseries.
The chart displays the message No index scan data available when the selected
time range contains no samples.
Reviewing Query Details
When you select a query from the Top Queries section of a server dashboard,
the console displays details about query execution. The query detail dashboard
summarizes a single query using the latest pg_stat_statements data and a set
of time-series charts.

The header includes the database name, the server name, and the text of the query. If you have configured AI in the Workbench, an AI Overview panel evaluates the query. See AI Query Analysis for details on the summary panel, the analysis report, and running suggested SQL from the report.
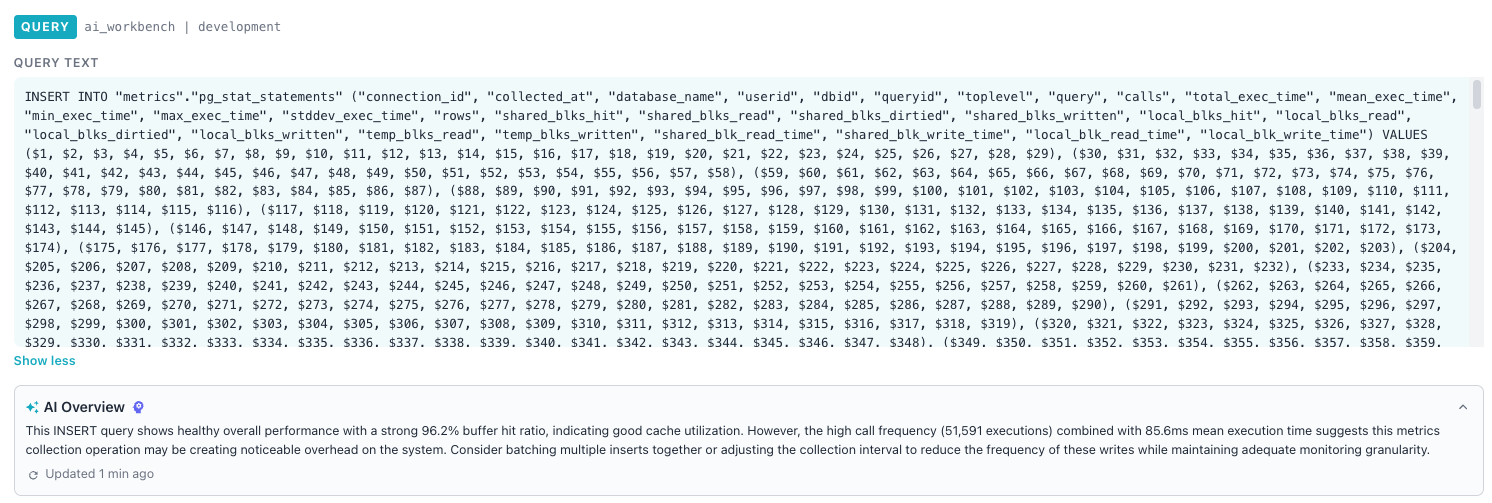
The header normalizes the query onto a single line, collapsing runs of
whitespace into single spaces for a compact preview. Select the
Show full query toggle to display a query that exceeds 120 characters; the
preview ends with an ellipsis.
When you're finished, you can use the Show less toggle to restore the compact
preview.
The Query Plan section appears below the AI Overview panel and defaults to
expanded; the expand/collapse state persists across browser sessions. The panel
fetches the PostgreSQL EXPLAIN output when the section first renders, and a
refresh button in the section header regenerates the plan on demand.
Note
The Workbench caches plans for five minutes to avoid redundant queries against the database server.
The Query Plan section displays plan data in two tabs: the Visual tab shows
a graphical flow diagram that the Workbench builds from the JSON EXPLAIN
plan, and the Text tab shows the standard EXPLAIN output in monospace
format for a concise view.

The Visual diagram uses a left-to-right layout. Leaf scan nodes display on
the left and the root node displays on the right. SVG bezier arrows connect
each child node to its parent.
Each tile in the diagram displays the node type and the relation or index name. A colored left border indicates the cost ratio relative to the root node:
- A red border marks nodes that consume over 80 percent of the total cost.
- An orange border marks nodes that consume over 50 percent of the total cost.
- The default border color applies to all other nodes.
Click a tile to open a popover with comprehensive node details. The popover displays the following information:
- The cost range from startup cost to total cost.
- The estimated row count and row width.
- The output columns the node produces.
- The execution strategy and scan direction.
- The planned and launched worker counts.
- Any filter, join, or index conditions.
Select the Text tab to display the execution plan with costs:

The Workbench uses EXPLAIN VERBOSE for the JSON plan to provide comprehensive
detail in the Visual tab. The Text tab uses standard EXPLAIN without
VERBOSE for a concise view of the execution plan.
Note
For parameterized queries that use $1, $2 placeholders, the Workbench
uses the GENERIC_PLAN option available in PostgreSQL 16 and later. Older
PostgreSQL versions display a friendly informational message instead of the
plan.
The Query Statistics section presents four key statistics drawn from the
latest pg_stat_statements snapshot for the query.

Four tiles provide statistics about the query:
- The
Total Callstile shows the cumulative execution count, formatted with thousands separators. - The
Total Timetile shows the total execution time across all calls, scaled to a readable unit such as microseconds, milliseconds, seconds, or minutes. - The
Mean Timetile shows the average execution time per call, using the same automatic unit scaling asTotal Time. - The
Avg Rows/Calltile shows the total rows divided by the call count, formatted to one decimal place. TheAvg Rows/Calltile displays--when the query has recorded no calls, because the average is undefined.
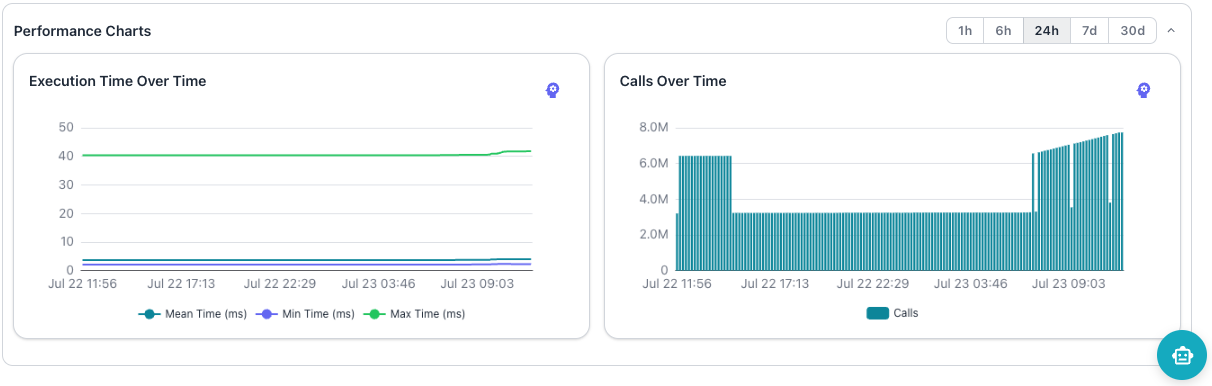
The Performance Charts section renders two charts and a time-range selector
in the section header. The selector offers 1h, 6h, 24h, 7d, and 30d
ranges that both charts share:
- The
Execution Time Over Timeline chart plots theMean Time (ms),Min Time (ms), andMax Time (ms)series across the range. - The
Calls Over Timebar chart plots the number of calls recorded in each interval as theCallsseries.
The execution time chart shows "No execution time data available", and the calls chart shows "No call frequency data available", when the selected time range contains no samples.