Using the Workbench
The pgEdge AI DBA Workbench provides a browser-based interface for monitoring and managing PostgreSQL database estates. This section of the guide covers the features available to users of the web client. For example:
- Reviewing Dashboards describes the monitoring dashboard hierarchy and the metrics each level displays.
- Managing Alerts explains how to view, acknowledge, and manage alerts in the web interface.
- Using AI Features covers AI-powered summaries, analysis, and the Ask Ellie assistant.
- Using Workbench with MCP Tools lists the Model Context Protocol tools and resources available to compatible AI clients.
- Managing Blackouts describes how maintenance windows suppress alerts for servers, clusters, and groups.
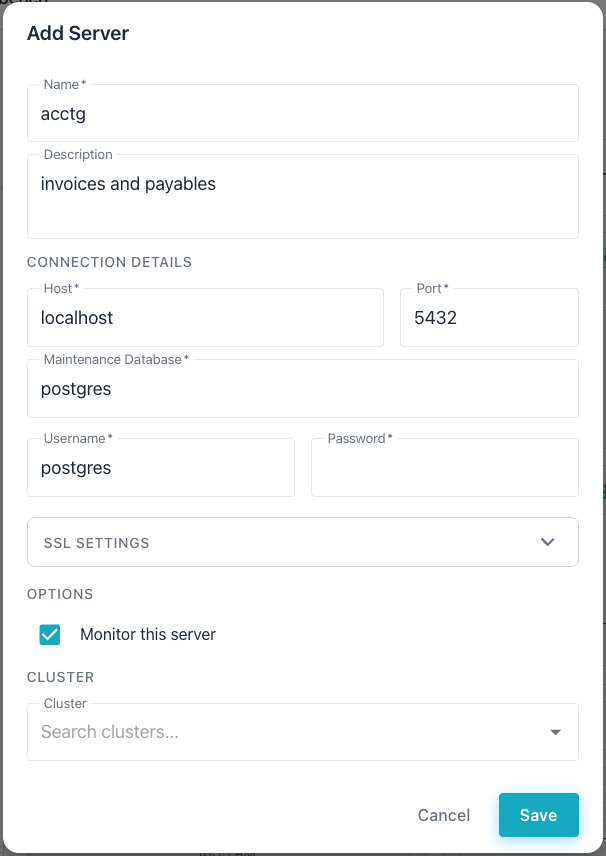
The Workbench client connects to an MCP server instance in your web browser. To connect, open a browser and navigate to the server address. When prompted, log in with the user credentials provided during installation to begin monitoring your PostgreSQL estate.
Using Workbench Features
The Workbench incorporates a number of features that simplify management of your database estate. Consistent and intuitive tooling make it easy to navigate through detailed metrics and alerts, resolving issues that may arise.
The cluster navigator occupies the left side of the console and provides tree-based navigation across groups, clusters, servers, and databases. Select a node in the navigator to review or update the dashboards, alerts, and AI insights for that scope.
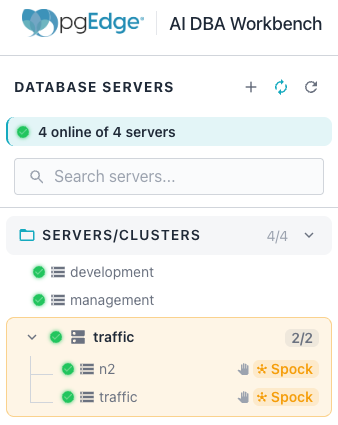
Hover over a server or cluster name to reveal a
gear icon that opens the Settings dialog for the selected object, allowing
you to review or modify connection details, cluster topology, alert overrides,
probe configuration, and notification channels.
Several panes, including the Navigation Pane, the Event Timeline, the
Query Plan, and the AI Overview, include a refresh icon. Use the
refresh icon to force an immediate update of the properties to reflect the
latest polled metrics (by default, metrics are collected every 5 minutes).
The Workbench console's graphic set includes the following additional interactive features:
- Time range selectors, offering 1h, 6h, 24h, 7d, and 30d options, appear on some panes to rescope the displayed data.
- Drillable elements let you navigate between dashboard levels; for example, clicking a database entry in Database Summaries opens the database dashboard, and clicking a server entry in Comparative Metrics opens the server dashboard.
- The Hide monitoring queries toggle on the
Top Queriespane filters out the Workbench's own monitoring queries. - Clicking a tile in the visual query plan diagram opens a popover with cost, row estimate, and filter details for that node.
Hint
If you have enabled AI in the Workbench, a purple brain icon appears on charts, KPI tiles, leaderboards, and queries. Click the icon to access an AI analysis that uses an agentic LLM loop to gather context and produce actionable recommendations. A purple brain icon indicates no analysis has run yet; an amber brain icon indicates a cached analysis is available for instant review.
Using the AI Chart Analysis Feature
The AI chart analysis feature provides LLM-powered insights for any chart or KPI tile in the monitoring dashboards. The analysis examines data trends, identifies anomalies, and generates actionable recommendations.
Note
The Workbench's AI features are available only when the server has a configured LLM provider. See Enabling AI Mode for configuration details.
Charts, KPI tiles, leaderboards, and the vacuum status panes each display a brain icon in the upper-right icon. Click the icon to open an analysis dialog and start the LLM analysis.

The analysis follows these steps:
- The Workbench checks for a cached analysis result.
- The Workbench fetches server context from the connection.
- The Workbench fetches timeline events for the time range.
- The Workbench serializes the chart data and sends it to the LLM.
- The LLM returns a structured analysis report.
The AI analysis renders as formatted markdown. Each chart analysis report contains a structured assessment that includes a summary and detailed recommendations. Trends and patterns for the metrics that are used to generate the graph or chart are also included in the report.
Use the download icon in the upper-right corner of the dialog to download the analysis. The downloaded file is in markdown format, and includes the chart details, the full analysis report, and a generation timestamp.
The analysis includes events in the currently selected timeline to identify correlations between metric changes and system events. The LLM considers the following event types:
- Configuration changes to PostgreSQL settings.
- Alert activations and resolutions.
- Server restarts and recovery events.
- Extension installations and upgrades.
- Blackout periods and maintenance windows.
SQL code blocks included in the analysis report include a play button in the upper-right corner. Click the play button to execute the query against the chart's associated database server. Results appear inline below the code block.

Write statements such as ALTER SYSTEM prompt a confirmation dialog before
executing. Read-only queries execute immediately.
The Workbench caches chart analysis results on the client side to avoid redundant LLM calls.
- An amber brain icon indicates that a cached analysis exists for the chart.
- The cache uses stable identifiers as the cache key; these include the metric description, connection, database, and time range.
- The cache expires after 30 minutes.
- Click an amber brain icon to open the cached report instantly.