Alerts Overview
The alert system monitors PostgreSQL metrics and notifies users when a metric exceeds its threshold or the alerter detects an anomaly. This guide explains how alerts appear in the web interface and how to manage the alert lifecycle.
Viewing Alerts
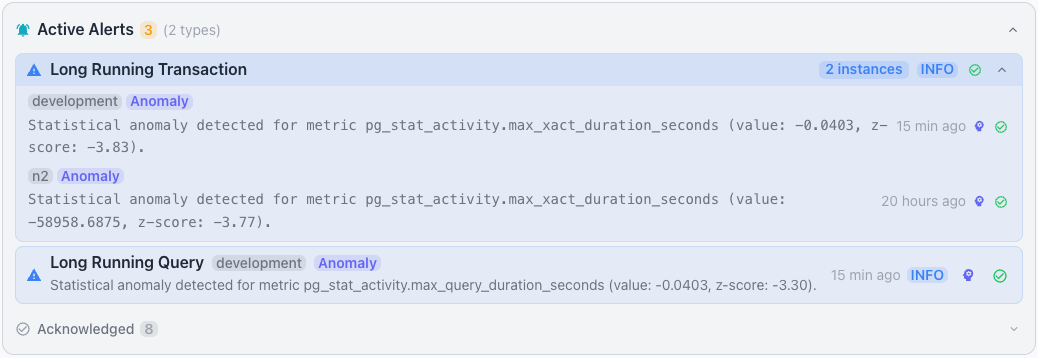
The Active Alerts panel displays active alerts for the scope selected in the
cluster navigator. Alerts appear grouped by severity and category. Each alert
shows the rule name, current metric value, threshold, and the server where the
alert originated.
Hint
Each alert in the Active Alerts panel displays a brain icon that triggers
an AI-powered analysis. The analysis examines the alert context, historical
patterns, and server configuration to produce actionable remediation
guidance. See AI Alert Analysis for details on this
feature.
Selecting a different node in the cluster navigator updates the alert list to reflect that scope. Estate-wide alerts appear when you don't select a specific node.
Each dashboard identifies its alert list with a bell icon and an
Active Alerts label; a count badge shows the number of current alerts. Use
the chevron on the right side of the heading to expand or collapse the list.
When no alerts are active, the panel displays a green banner with the message
No active alerts.
Severity Levels
Alerts use three severity levels to indicate urgency:
- A critical alert indicates a severe issue that requires immediate attention.
- A warning alert indicates a potential problem that needs prompt investigation.
- An info alert indicates a noteworthy condition for general awareness.
The severity level determines the visual styling of each alert in the
Active Alerts panel. Critical alerts appear with red indicators; warning
alerts appear with amber indicators; info alerts appear with blue indicators.
Alert Lifecycle
Each alert progresses through a defined set of states from creation to resolution.
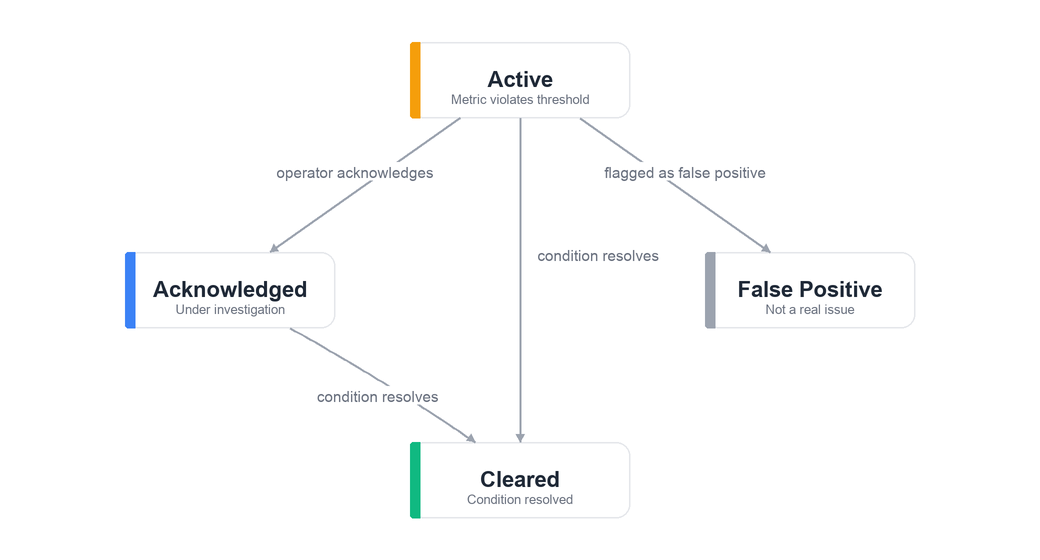
- Active: The alerter creates an alert with active status when a metric violates a threshold. The alert remains active until the condition resolves or an operator takes action; the system updates the metric value on each evaluation cycle while the alert stays active.
- Acknowledged: An operator acknowledges an active alert to indicate that
the issue is under investigation. Acknowledged alerts remain visible in the
Active Alertspanel but move to a separate section; acknowledging an alert does not resolve the underlying condition. - Cleared: The alerter automatically clears an alert when the triggering condition returns to normal. The alert cleaner runs every 30 seconds and re-evaluates active alerts; when a metric value no longer violates the threshold, the system marks the alert as cleared and records the timestamp.
- False Positive: An operator marks an alert as a false positive to indicate that it does not represent a real issue; the false positive designation helps refine alert accuracy over time.
To acknowledge an alert, click the acknowledge icon, a green checkmark, on an
active alert to open the Acknowledge Alert dialog.
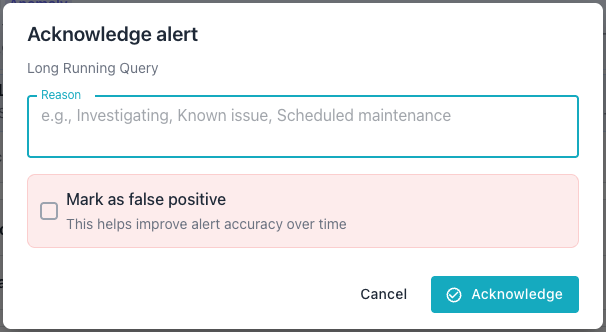
Enter a reason for the acknowledgment in the Reason field, such as
Investigating or Known issue. Check Mark as false positive if the alert
does not represent a real issue. The alert moves to the acknowledged section of
the status panel once you click Acknowledge. The system records the operator,
the reason, the false positive flag, and the timestamp.
Acknowledging an alert signals to other operators that someone is investigating the issue; it does not resolve the underlying condition.
Viewing Acknowledgments and Past Alerts
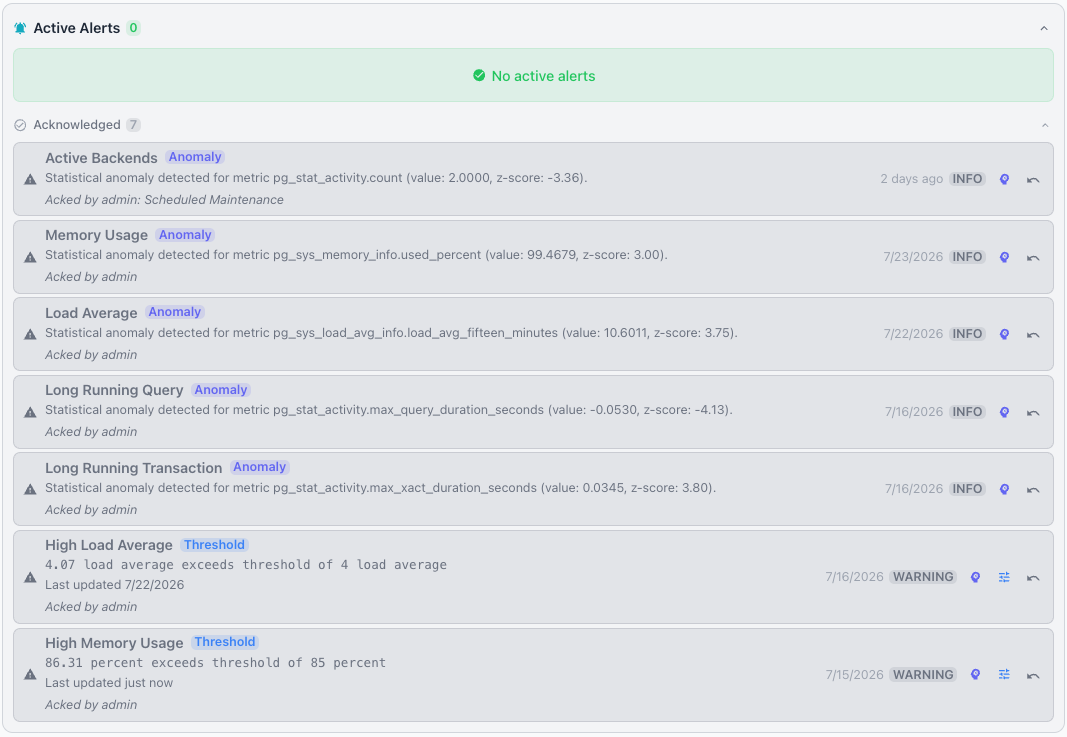
The Active Alerts panel displays the acknowledgment reason beneath each
acknowledged alert. The entry shows the operator's name followed by the reason
text; a False Positive label appears next to alerts that an operator flagged
as false positives.
The Event Timeline also displays this information. Expand an alert's
acknowledgment event in the timeline to view the operator, the reason, and the
false positive flag.
Use the Event Timeline on any dashboard to review alerts that are no longer
active, such as an alert that occurred last week. Set the time range selector
to 7d or 30d to include alerts from further back; the selector also offers
a 24h option for recent history.
Enable the Alert, Cleared, and Acked buttons in the Event Timeline to
display triggered, resolved, and acknowledged alert events within the selected
range. Select an event icon to view its details, including the triggering
threshold and, for acknowledged alerts, the operator, reason, and false
positive flag.

See Event Timeline for the full range of trackable event types and how the timeline groups simultaneous events.
Editing Alert Thresholds
Users can edit alert thresholds directly from an alert instance. The edit button on an alert opens the Edit Override dialog for the associated rule and scope. The dialog allows adjustments to the threshold, operator, severity, and enabled state.
The scope dropdown displays the available override levels: server, cluster, and group. The dialog pre-selects the scope that matches the originating context of the alert.
Blackout Interaction
During an active blackout period, the alerter suppresses new alerts for the affected connection or database. Existing active alerts remain visible during a blackout; the blackout only prevents the alerter from creating new alerts. See Managing Blackouts for details on maintenance windows.
Related Documentation
- Alert Rule Reference lists all built-in alert rules and their default thresholds.
- AI Alert Analysis describes the AI-powered analysis feature for alerts.