Reviewing Database Details
The database dashboard presents detailed metrics for a single database. Select
a database tile from the Database Summaries section of a server's dashboard
to view database details.
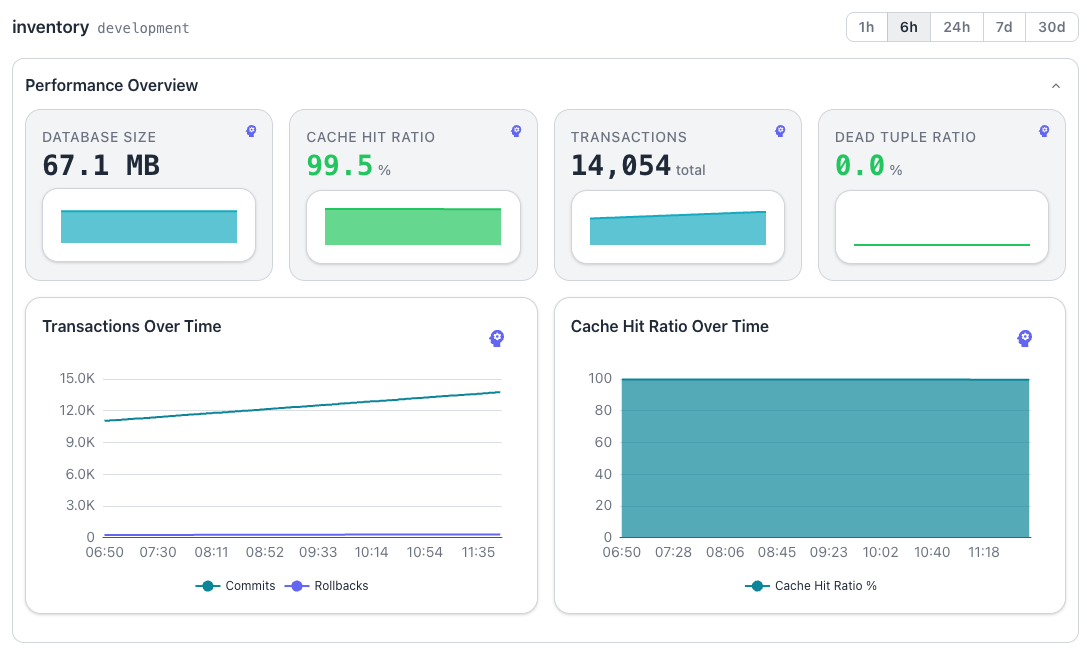
The header displays the database name and the server name; use the X in the
upper-right corner to close the dashboard.
Performance Overview
The Performance Overview pane summarizes database activity and current
health. The pane displays the following tiles:
- The
DATABASE SIZEtile shows the total size of the database in a human-readable format. - The
CACHE HIT RATIOtile shows the buffer cache hit ratio as a percentage. - The
TRANSACTIONStile shows the total combined commit and rollback count. - The
DEAD TUPLE RATIOtile shows the dead tuple percentage across all tables.
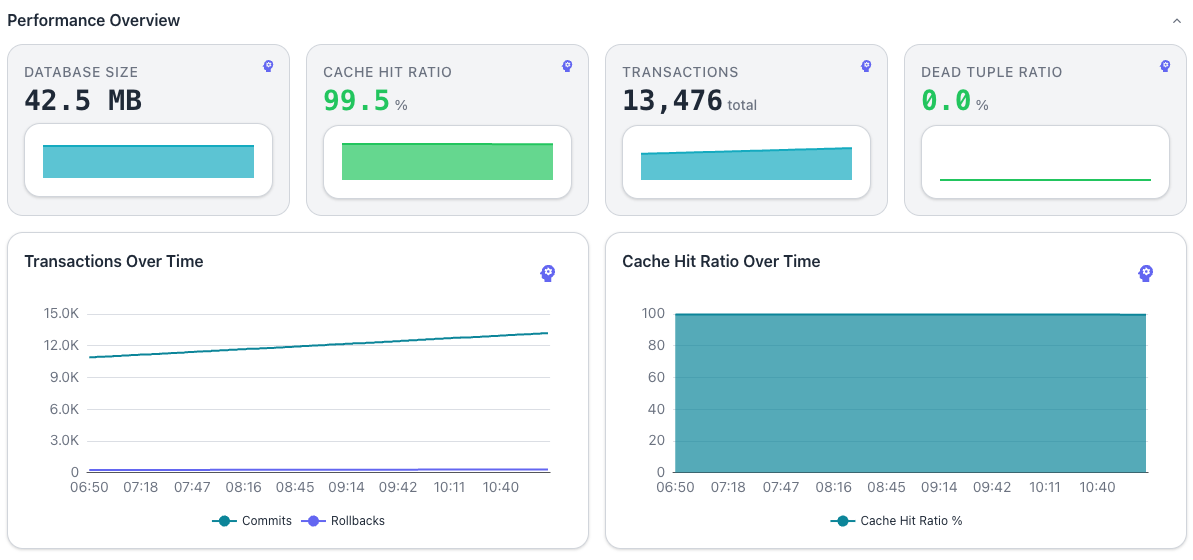
The pane also displays the following time-series charts:
- The
Transactions Over Timechart plots commits and rollbacks as separate lines over the selected range. - The
Cache Hit Ratio Over Timechart tracks the cache hit ratio over the selected range.
Each tile and each chart displays a brain icon that opens an AI analysis of the displayed data.
Table Leaderboard
The Table Leaderboard pane ranks tables using selectable sort criteria.
The pane provides the following sort buttons:
- The
Rowsbutton sorts tables by live row count; the Workbench selects it by default. - The
Seq Scansbutton sorts tables by sequential scan count. - The
Dead Tuplesbutton sorts tables by dead tuple count. - The
Modificationsbutton sorts tables by total inserts, updates, and deletes.
Each row shows the fully qualified table name, a dead tuple count, a relative bar indicator, and a row count. Click a table entry to navigate to the object dashboard for that table.
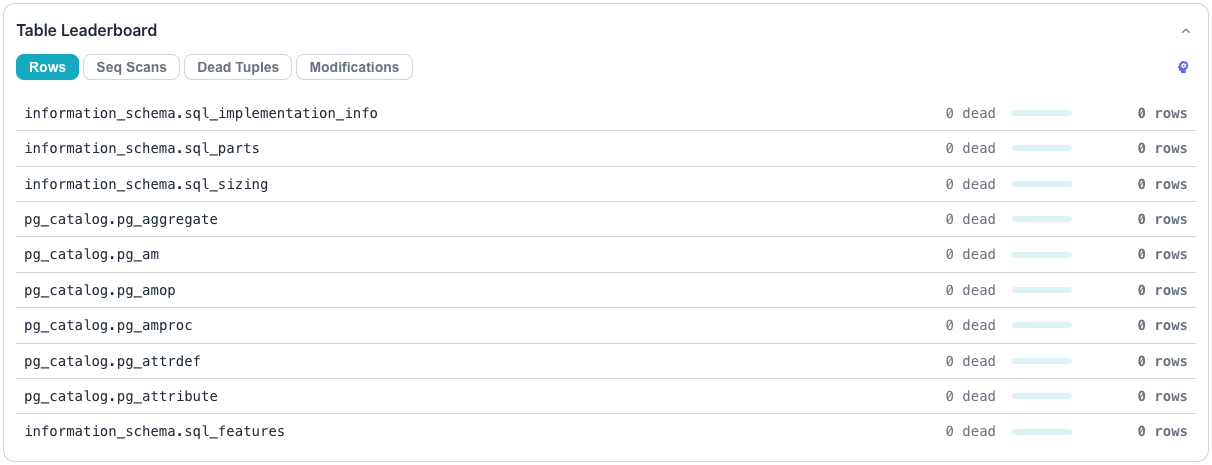
An AI Analysis button with a brain icon sits beside the sort buttons. The analysis covers data across all sort categories for the listed tables.
Index Leaderboard
The Index Leaderboard pane ranks indexes using selectable sort criteria.
The pane provides the following sort buttons:
- The
Readsbutton sorts indexes by tuples read count; the Workbench selects it by default. - The
Scansbutton sorts indexes by index scan count. - The
Unusedbutton surfaces indexes with the lowest scan counts.
Each row shows the index name, the parent table name on a second line, a scan count, a relative bar indicator, and a read count. Click an index entry to navigate to the object dashboard for that index.
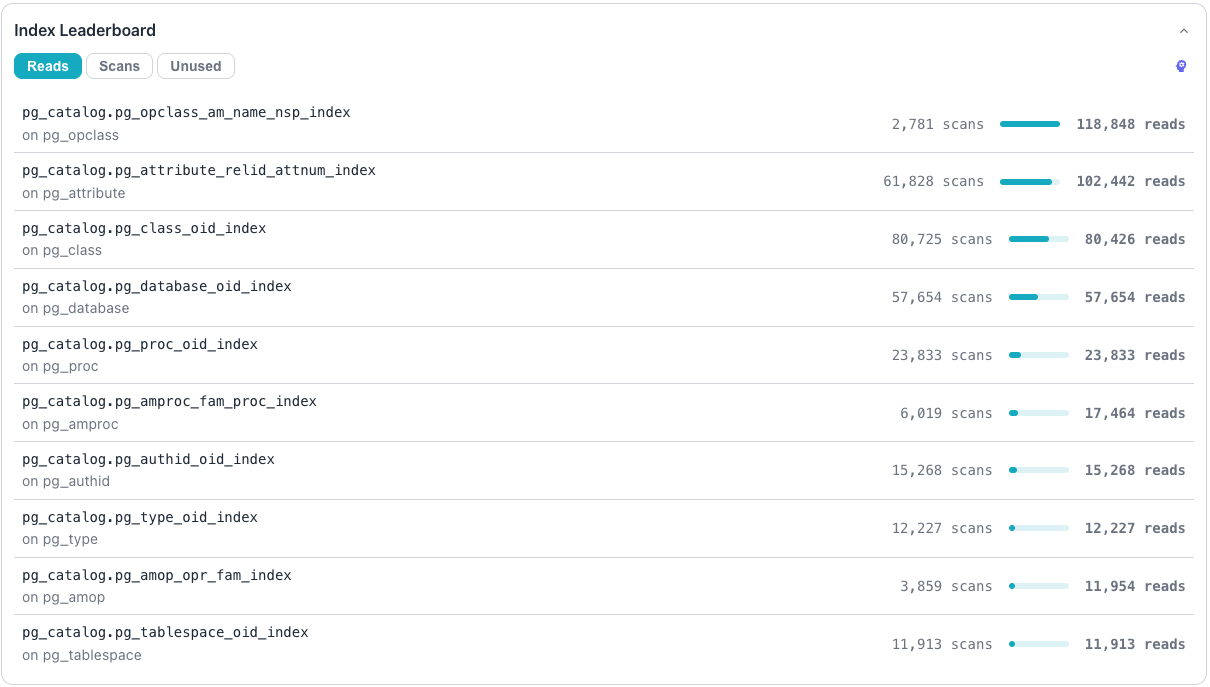
An AI Analysis button with a brain icon sits beside the sort buttons. The analysis covers data across all index metrics for the listed indexes.
Vacuum Status
The Vacuum Status pane displays a sortable table of all tables sorted by dead
tuple ratio in descending order.
The table includes the following columns:
- The
TABLEcolumn identifies each entry. - The
LAST VACUUMcolumn shows the most recent manual vacuum timestamp. - The
LAST AUTOVACUUMcolumn shows the most recent autovacuum timestamp. - The
DEAD TUPLEScolumn shows the raw dead tuple count. - The
DEAD RATIOcolumn shows the dead tuple percentage.
The pane displays aging timestamps in amber and red to indicate stale vacuum
activity. The pane displays Never in red when vacuum has never run for a
table; high DEAD RATIO values appear in bold red.
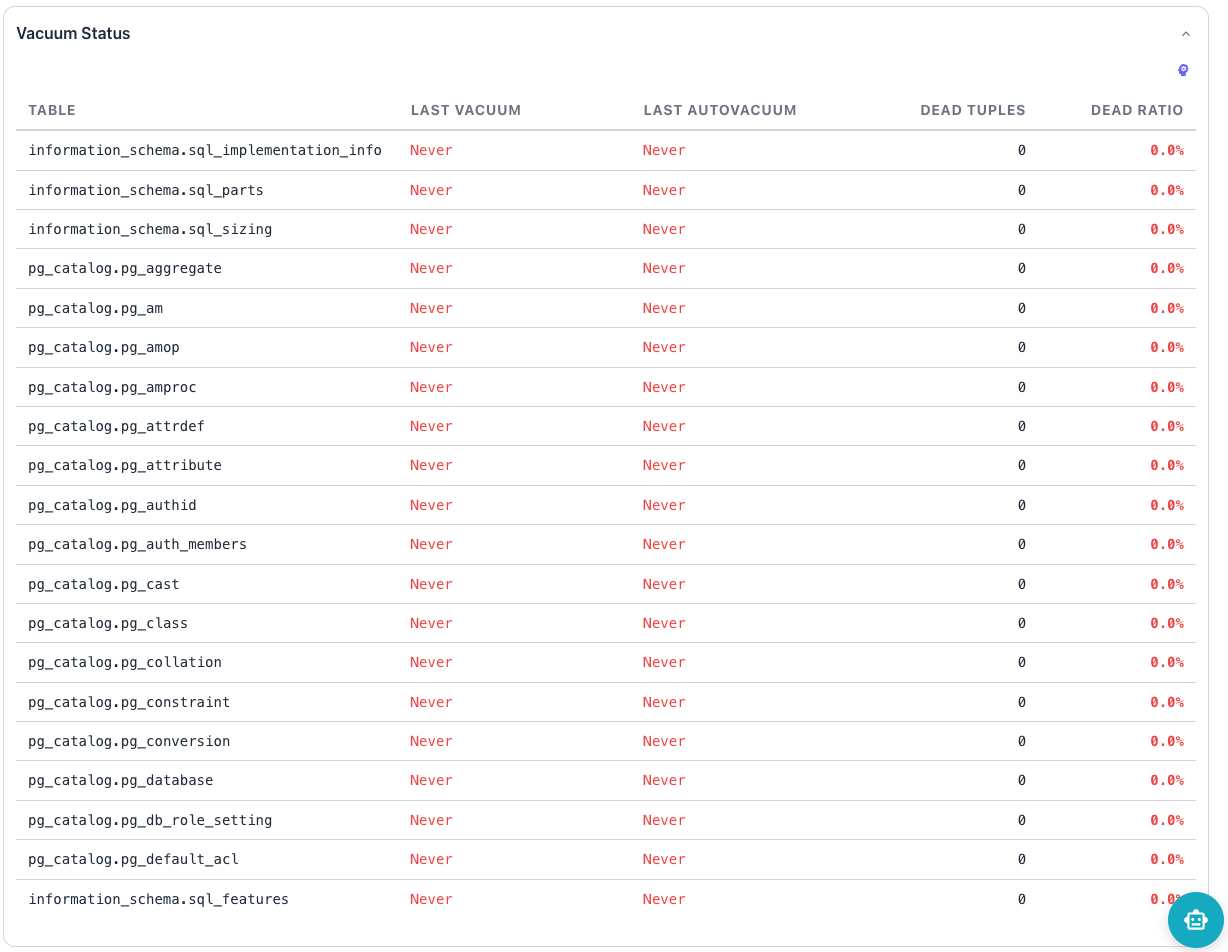
An AI Analysis button with a brain icon provides vacuum recommendations.