Servers Show Offline or Stale Status
The cluster navigator sometimes reports servers as offline or shows sample data that no longer updates. This page describes two related scenarios and explains how to tell them apart. The first scenario is a transient display glitch that clears on its own; the second is a real collector outage that requires investigation.
Use the scenario descriptions below to decide which situation applies to you. A transient status glitch self-resolves within 30 to 60 seconds, while a stopped collector leaves sample data stale across many servers until you intervene.
Transient Initialising Status
The Workbench occasionally marks servers offline while the collector finishes establishing its monitoring connection. This status is incorrect, and it clears on its own within about a minute.
Symptom
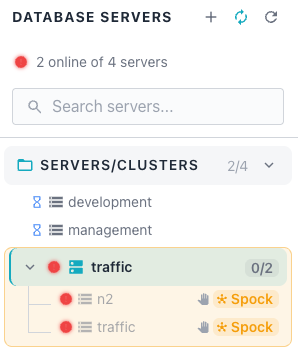
The Database Servers panel shows a reduced online count, such as "2 online of 4 servers"; an affected cluster appears entirely offline. In the observed case, a cluster named "traffic" containing the member servers "n2" and "traffic" displayed "0/2" with a red status indicator. Both member servers showed red status dots.
The AI Overview panel for the cluster reported both servers offline with no connectivity. The panel flagged active warning-level alerts and stated that the situation needed immediate attention. No blackout was active, and no recent events explained the reported outage.
Diagnosis
The displayed offline status is often incorrect; the database connections behind the panel are frequently still healthy. You can confirm this by asking the Ask Ellie assistant to query each server connection directly. For details on the assistant, see Ask Ellie.
In the observed case, Ask Ellie tested all four server connections directly by port and host. The assistant found that each connection was connected and executing queries successfully. This result confirmed that the reported outage was a display problem rather than a real database failure.
Ellie explained the discrepancy between the panel and the live connections. The Workbench's displayed status can get stuck in an "initialising" state while the collector establishes its monitoring connection, performs initial metric collection, or builds baseline statistics. This is a transient collector-side status problem, not an actual database outage.
Ellie suggested several first steps before taking further action:
- Refresh the console to reload the current server status.
- Check the collector logs for connection errors.
- Wait 30 to 60 seconds for the probes to start collecting, since initialization can take that long.
Resolution
When the stale offline status does not clear on its own, restart the Workbench backend services in the following order. Restart each service and allow it to finish starting before moving to the next one.
- Restart the Collector.
- Restart the Alerter.
- Restart the Server.
After restarting the services, confirm that the status of each affected server has updated to reflect its actual online state. The Database Servers panel should then show the correct online count.
Collector Stopped Collecting Metrics
The collector sometimes stops gathering metrics from every monitored server while the databases themselves stay online. This scenario does not self-resolve; the sample data grows stale until you restart the collector. Unlike the transient status glitch above, the sample ages climb steadily and never recover on their own.
Recognising This Scenario
The clearest signal is stale sample data across many or all servers rather than a single one. When every server reports the same large gap since its last sample, the collector has likely stopped for all of them at once. A problem affecting only one server usually points to that server, not to the collector.
The databases in this scenario remain online and continue accepting connections. Because they are healthy, direct connection tests still succeed, which can make the estate look fine at first glance.
Diagnosis
Ask the Ask Ellie assistant to check sample freshness across your servers. Request the time since the last sample and the sample count for each server; a consistent, large gap across servers is the key diagnostic signal. For details on the assistant, see Ask Ellie.
In the observed case, Ellie returned a table of servers with their port, time since the last sample, and sample count. The "management" server on port 5433 showed a last sample "23 hours ago" with 40 samples. The "traffic" server on port 5434 and the "n2" server on port 5435 each showed "23 hours ago" with 20 samples.
Ellie identified the underlying problem from this table. The collector had stopped gathering metrics from all servers around 12:10 PM the previous day, even though the databases remained online and reachable. The consistent last-sample time across every server pointed to a single collector-wide failure rather than a per-server outage.
Watch for a misleading detail in this scenario. Some connections can still look "fine" in the UI because they hold more historical samples, or because the UI shows cached data. This appearance can mask the fact that collection has actually stopped everywhere.
Resolution
This scenario is almost certainly a collector crash or hang, so start by restarting the collector service. Perform the following steps in order and confirm the outcome of each before moving on.
- Restart the collector service to recover from a crash or hang.
In the following example, the systemctl restart command restarts the
collector service:
sudo systemctl restart pgedge-ai-dba-collector
- Check the collector logs for errors around the time collection stopped.
In the following example, the journalctl command shows the collector logs;
filter by time with the --since and --until options to narrow the output
around the observed stall time:
sudo journalctl -u pgedge-ai-dba-collector \
    --since "2026-07-01 12:00" --until "2026-07-01 12:30"
- Verify that the collector is running after the restart.
In the following example, the systemctl status command confirms that the
collector service is active:
sudo systemctl status pgedge-ai-dba-collector
After the collector restarts, ask Ask Ellie to check sample freshness again. The time since the last sample should drop to a small value as new metrics arrive for each server.